The healthcare industry has always been a complex ecosystem, and maintaining the financial health of this industry is crucial for ensuring quality patient care.
Revenue Cycle Management (RCM) is one such pivotal aspect of the healthcare ecosystem. It covers the entire economic process, from appointment scheduling to final payments.
Effective RCM ensures timely and accurate reimbursement for services, directly impacting an organization’s ability to provide quality care.
RCM KPIs in healthcare are essential tools for measuring the effectiveness and efficiency of the RCM process.
These RCM KPIs provide measurable values to help organizations assess their financial and operational performance.
By tracking and analyzing these metrics, healthcare organizations can identify improvement areas, streamline operations, reduce economic losses, and enhance overall economic performance.
In this blog, we will explore various KPIs critical to optimizing RCM in healthcare.
RCM KPIs, or Revenue Cycle Management Key Performance Indicators, are specific metrics used to gauge the efficiency and effectiveness of the revenue cycle management process within healthcare organizations.
These RCM KPIs are key performance indicators in healthcare, providing valuable insights into how well a healthcare provider manages its financial aspects.
RCM KPIs are quantifiable measures that help healthcare organizations monitor and assess various aspects of their revenue cycle.
The primary purpose of these KPIs is to identify strengths and weaknesses in the financial operations, enabling healthcare providers to make data-driven decisions.
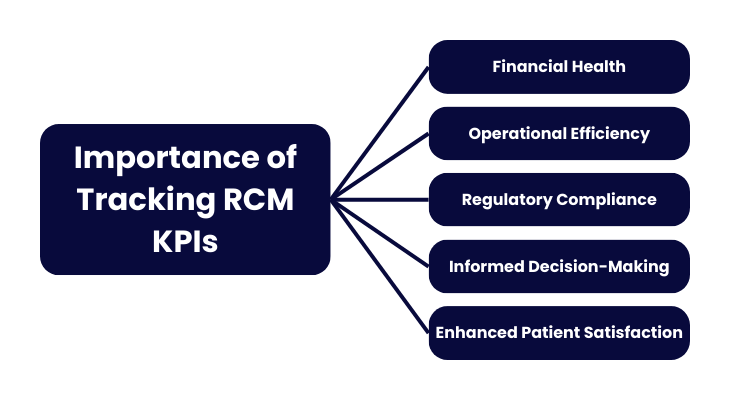
Tracking RCM KPIs is vital for several reasons:
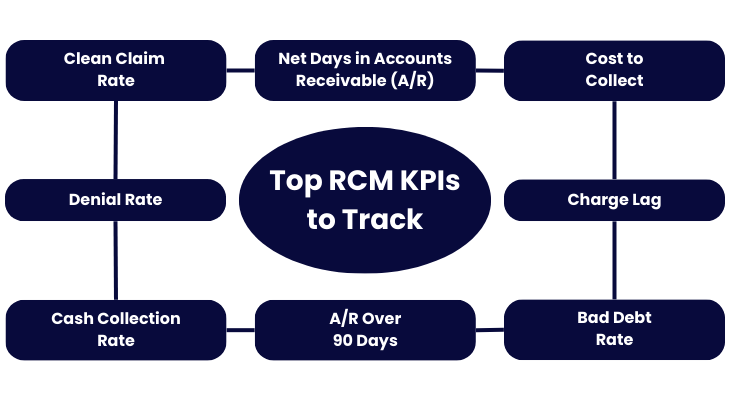
We have covered a few revenue cycle KPIs, which can provide the metrics you need to manage your RCM cycle effectively.
Net Days in Accounts Receivable (A/R) is a crucial KPI in revenue cycle management. It measures the average number of days it takes for a healthcare organization to collect payments owed from patients and insurers after the service has been provided.
These revenue cycle management metrics are significant because they reflect the efficiency of the billing and collections process.
Fewer days indicate a more efficient process, resulting in quicker cash flow. In comparison, a higher number suggests potential issues in the revenue cycle that need to be addressed.
To calculate Net Days in Accounts Receivable, use the following formula:
Net Days in A/R = (Total Net Receivables / Average Daily Net Patient Service Revenue)
Where the Total Net Receivables is the total amount of money owed to the organization by patients and insurers, and the Average Daily Net Patient Service Revenue is calculated by dividing the total net patient service revenue over a specific period (typically a year) by the number of days in that period.
Industry benchmarks for Net Days in A/R can vary depending on the type and size of the healthcare organization. However, a standard benchmark is to aim for 30 to 40 days.
Organizations with Net Days in A/R significantly higher than this range should investigate and address the root causes, such as billing delays, issues with claim denials, or inefficiencies in the collections process.
To improve Net Days in Accounts Receivable, healthcare organizations should ensure timely and accurate billing by generating and sending out bills promptly after services are rendered.
Efficient claim management involves regularly monitoring and following up on denied or delayed claims to resolve issues quickly.
Clear patient payment policies should be established and communicated to encourage timely payments. The use of advanced billing and collections software can automate processes and reduce manual errors.
One crucial revenue cycle management key performance indicator is the Cost to Collect. It measures the total expenses in collecting payments from patients and insurers.
This RCM KPI includes costs for billing, collections, staff salaries, technology, and other administrative expenses.
A lower cost to collect implies that the revenue cycle is running efficiently, with less money spent recovering owed payments.
By tracking the Cost to Collect, healthcare organizations can identify inefficiencies, which can help pinpoint areas where costs can be cut without affecting service quality.
Optimizing resources ensures effective allocation to maximize collections and minimize expenses. Improving profitability involves reducing unnecessary expenditures in the revenue cycle.
To calculate the Cost to Collect, use the following formula:
Here, the Total Revenue Cycle Costs include all expenses related to the billing and collections process, and the Total Cash Collected is the total amount of cash received from payers and patients.
The current average Cost to Collect for most practices is around 3%. Organizations with costs significantly higher than this benchmark should investigate the underlying causes and implement strategies to reduce expenses.
For instance, healthcare organizations implementing automated billing and collections systems can significantly reduce manual errors and labor costs.
Outsourcing certain revenue cycle functions to specialized firms can also enhance efficiency. Regular staff training on best practices and efficient workflows is crucial for boosting productivity.
Continuously reviewing and refining billing and collections processes helps eliminate unnecessary steps and reduce costs.
The Clean Claim Rate (CCR) measures the percentage of claims submitted to payers that are free of errors and processed without needing additional information or corrections.
A high clean claim rate is crucial because it indicates efficient and accurate claims processing, minimizing rework and payment delays.
When claims are clean, they are processed faster, resulting in quicker reimbursements and reduced administrative costs associated with correcting and resubmitting claims.
To calculate the Clean Claim Rate, use the following formula:
In this formula, the Number of Clean Claims Submitted refers to the processed and accepted claims that do not need additional information or corrections.
The Total Number of Claims Submitted includes all claims sent to payers within a specific period.
The benchmark for the Clean Claim Rate is 98%. Organizations with a clean claim rate below this benchmark should examine their claims submission process for errors and implement strategies to improve accuracy.
One of the best practices for maintaining a high Clean Claim Rate is ensuring faster claim processing and reimbursement, which leads to better cash flow and reduced administrative burdens.
The Denial Rate measures the percentage of claims that payers deny. This KPI is essential because a high denial rate can threaten your income, as you are not getting paid for the services you provide.
Reducing the denial rate is critical for improving cash flow and operational efficiency.
To calculate the Denial Rate, use the following formula:
Here, the Number of Denied Claims refers to the claims that have been rejected by payers, and the Total Number of Claims Submitted includes all claims sent to payers within a specific period.
The benchmark for Denial Rate is typically below 8%. Maintaining a low denial rate is critical to the financial health of your practice, as it ensures that you are getting paid for the services you provide and minimizes revenue loss due to denied claims.
Verifying patient information, coverage details, and coding accuracy before submitting claims is essential to maintaining a low denial rate.
Regular staff training on coding practices, documentation requirements, and payer-specific guidelines can significantly reduce errors.
Utilizing automated claims scrubbing tools helps detect and correct errors prior to submission. A robust denial management process should be in place to quickly address and appeal denied claims while identifying common denial reasons.
The Bad Debt Rate is a key performance indicator in healthcare. It refers to the percentage of accounts receivable that a practice has to write off because they cannot be paid off.
These are essentially services provided for which the healthcare provider will not receive payment. Keeping the alarming debt rate at a minimum is crucial for maintaining a profitable practice, as high alarming debt rates can severely impact a provider’s financial health, reducing funds available for operational expenses and investments in patient care.
The Bad Debt Rate can be calculated using the direct write-off or allowance methods.
Here, the Total Bad Debts is the total amount of accounts receivable written off as uncollectible, and the Total Gross Revenue is the total revenue generated before any deductions.
Educating patients about their financial responsibilities, payment options, and assistance programs at the time of service is essential to minimizing bad debt.
Always conduct pre-service financial screenings to assess their ability to pay and discuss payment plans or financial assistance if needed.
Issue bills promptly after services are rendered and maintain clear, regular communication with patients regarding their account status and payment options.
Try to Implement a structured collections strategy with early intervention and follow-up on overdue accounts to ensure timely collection.
The Cash Collection Rate is one such revenue cycle management key performance indicator that measures the percentage of billed charges that are collected, reflecting the organization’s ability to convert services rendered into actual cash flow.
This RCM KPI is critical for evaluating the effectiveness of the revenue cycle. A high cash collection rate indicates efficient billing and collections processes, while a low rate suggests potential issues that must be addressed.
To calculate the Cash Collection Rate, use the following formula:
In this equation, the Total Cash Collected is the total cash received from payers and patients.
Total Net Revenue Billed is the total revenue billed minus contractual allowances and adjustments.
The benchmark for a Cash Collection Rate is typically 90% or higher. Maintaining a high cash collection rate ensures more cash flow for your business, helping to sustain operations.
To improve cash collection rates ensure accurate and timely billing to reduce errors and delays.
Also, strengthen follow-up procedures and collection strategies to recover owed payments efficiently. Offer multiple payment options and clear billing communication to facilitate timely payments.
A/R Over 90 Days is the revenue cycle management key performance indicator, which measures the percentage of accounts receivable that have been unpaid for 90 days or more.
Monitoring this RCM KPI is crucial because older accounts are less likely to be collected, negatively impacting cash flow and financial stability.
High levels of aged receivables can indicate inefficiencies in the billing and collections process and may lead to increased bad debt.
To calculate A/R Over 90 Days, use the following formula:
The total A/R over 90 days is the total amount of accounts receivable outstanding for more than 90 days, and the total accounts receivable is the total amount of all accounts receivable.
To maintain A/R Over 90 Days below 10%, regularly monitor aging reports to identify and address overdue accounts promptly. Implement systematic follow-up procedures for these accounts and enhance patient communication regarding outstanding balances and payment options.
Charge Lag refers to the number of days between the date a service is provided and the date the charge for that service is entered into the billing system.
This key performance indicator in healthcare is critical because it directly affects cash flow. Longer charge lags lead to delays in billing and collections, resulting in slower cash inflow and potential financial strain on the organization.
Reducing charge lag improves cash flow by ensuring that charges are promptly billed and collected.
To measure Charge Lag, use the following formula:
In this RCM KPI, the Sum of Days from Service to Charge Entry is the total number of days between the service date and the date the charge is entered for all charges, and the Total Number of Charges is the total number of charges entered within a specific period.
To minimize Charge Lag, aim to enter charges within 1 to 5 days, ideally within 24 hours. Optimize this process by implementing electronic health record (EHR) systems for automated charge entry, standardizing workflows to reduce delays, and training staff on the importance of timely charge entry and best practices for efficiency.
There are several tools and software for tracking KPIs. Some of these are:
Regular Review and Analysis Practices is an ongoing process, and read on to learn how to perform this process:
Involving the Healthcare Team in RCM KPI Monitoring is always considered the best practice. Make sure that you:
Effective revenue cycle management is crucial for healthcare organizations, ensuring financial health and operational efficiency.
Monitoring and optimizing key performance indicators (RCM KPIs) such as Net Days in Accounts Receivable (A/R), Cost to Collect, Clean Claim Rate, Denial Rate, Bad Debt Rate, Cash Collection Rate, A/R Over 90 Days, and Charge Lag enables providers to streamline processes, improve cash flow, and alleviate administrative burdens.
Implementing robust tracking tools and software, conducting regular performance reviews, and engaging the healthcare team in monitoring efforts are essential for continuous enhancement.
These practices support sustainable financial performance, enhance patient care delivery, and secure long-term organizational success.
Discover ProMantra, a trusted leader in healthcare IT services since August 2003. We provide high-quality Revenue Cycle Management (RCM) solutions across the healthcare industry.
Our comprehensive services enable U.S. healthcare providers to operate more efficiently, compete effectively, and deliver unparalleled patient care.
At ProMantra, we pride ourselves on maintaining rigorous quality control frameworks and adhering to global standards such as ISO 27001 and ISO 9001. We are committed to innovation and service delivery excellence, continually evolving to meet the dynamic needs of our clients and the changing healthcare landscape.
Our dedicated workforce is our greatest asset, and we invest in their growth and development to ensure they deliver world-class Healthcare IT services.
Contact us now to start your journey towards enhanced efficiency and success in the healthcare industry.
